|
|
|
|
Following the user manual of chi3D, in order to get fields for example the beam profile the matlab code is given: [Eftfxfy_o,Eftfxfy_e] = getFields(obj,{'pulse1','BeamProfile',I_xy}) . We get an error message: ''Undefined function or variable 'I_xy'.''
Questions:
1-What is the matlab code to define I_xy?
2- What is the matlab code for the plot window that is pulled up when running the ''long pulse SHG'' example given in the forum?
3-The name of plot window is ''detectors: plot::SHG''. The plot window is update as the code is progressed at each ''showResultEach'' step let's say each 100 steps. How can I access to data for each plot at each 100 steps.
4- What is the matlab code if you want to get and save data for I_xy or spectrum as the crystal length increases let's say in each 100 steps?
5- What is the matlab code if you want to get and save data for I_xy, spectrum,phase, total energy etc as one or more parameters of the input pulse changes such as alpha_x, pulse energy, beam radius and so on?
|
|
Administrator
|
1. The property name "'BeamProfile' in combination with a two-dimensional array defines the intensity profile of a pulse within the "run" or "getFields" method. Ixy must have the same sampling (Nx,dx,Ny,dy) as defined in obj.simProp and must be a real two dimensional intensity distribution, for example from a camera image of the pump beam. To give an example the following code reads in a camera image to driving an SHG.
Example:
%Every new instance of the chi3D class with no further redefined properties
%is automatically set to be an example for an SHG of a pulse as defined in obj.beamProp and obj.simProp
obj=chi3D('tag','SHG example with measured fundamental beam profile');

%% the run method starts the computation of the SHG with an internally generated gaussian pulse profile defined in obj.simProp.*_pulse1
[Eftfxfy_o,Eftfxfy_e]=obj.run('pulse1');

%% Alternatively an external two dimensional beam profile can be used for the simulation
%load an image from your hard disk
image=obj.importImageData('measurments/IRpump_for_SHG.dat');
%interpolated the image to fit the simulation sampling (Nx,dx,Ny,dy)
Ixy=obj.interpBeamProfile(image,pixelSize); %pixelSize is a number defining the dimensions of each pixel of loaded image, e.g. 4.4e-6 for a standard spiricon camera
%use the run method together with the "BeamProfile" property to start the simulation with the loaded spatial beam profile
[Eftfxfy_o,Eftfxfy_e]=obj.run({'pulse1','BeamProfile',Ixy});
Tino Lang
|
|
Administrator
|
This post was updated on .
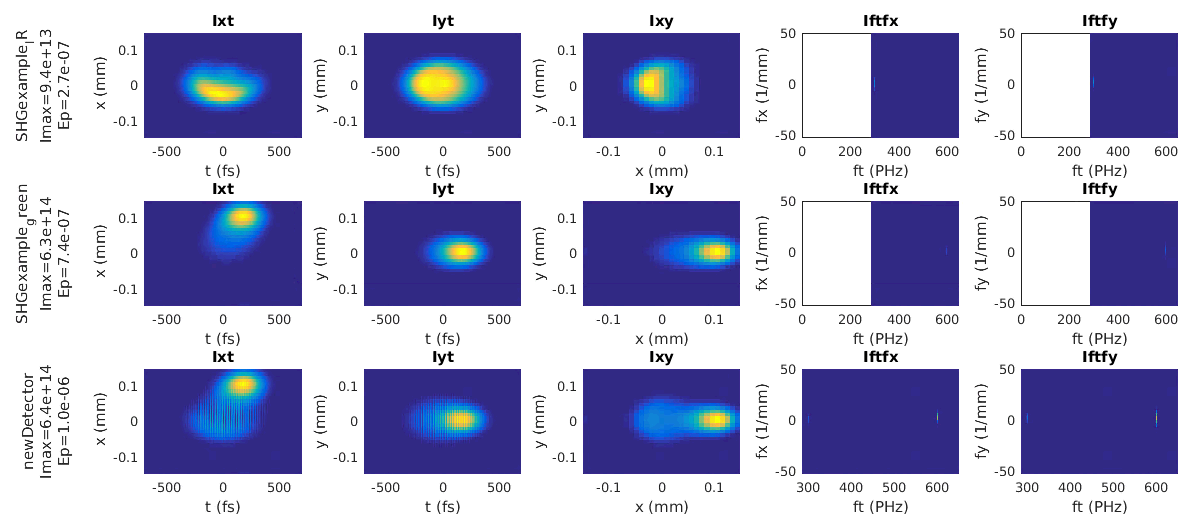
2. The run and the getResults method of chi3D allows for plotting the spatiotemporal and spectral beam profiles of each detector as defined in obj.detectors. For this the plotIntegratedProfiles-property needs to be set.
Example:
The SHG example already contains two predefined detectors for the fundamental IR and the second harmonic green pulse with activated plotting flag
>> obj.detectors.SHGexample_green

ans =

              polarization: 'e'
                     ftlim: [0 Inf]
                     fxlim: [-Inf Inf]
                     fylim: [-Inf Inf]
              spectralData: 1
             spacetimeData: 1
                 peakpower: 1
    plotIntegratedProfiles: 1
                  logScale: 0
Further detectors can be easily added as follows:
%% define a new detector for both polarizations showing the superposition of fundamental and second harmonic

obj.detectors.newDetector.polarization='both';
obj.detectors.newDetector.plotIntegratedProfiles=1;

[Eftfxfy_o,Eftfxfy_e]=obj.run('pulse1'); %the results are plotted after N simulation step as defined in obj.simProp.showResultEach. For obj.simProp.showResultEach=0 the results are only plotted for the first and the last step. use obj.run.help for more information

obj.getResults(Eftfxfy_o,Eftfxfy_e); %use obj.getResults.help for more information
Tino Lang
|
|
Administrator
|
This post was updated on .
3. Yes, the results for each detector after N steps is saved in obj.simResults.detectorName, where the detector name must be previously defined in obj.detectors.
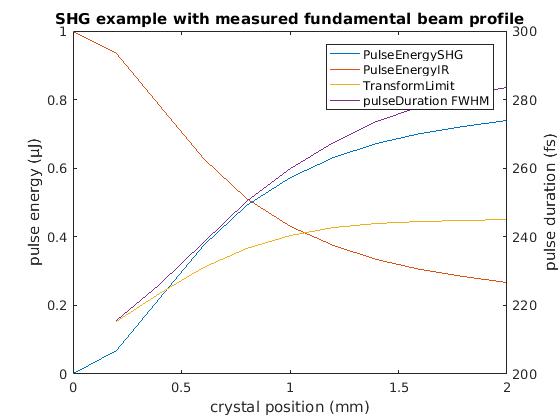
Example 1: plot results for different crystal positions
[Eftfxfy_o,Eftfxfy_e]=obj.run('pulse1'); %the results together with the current position z in the crystal are saved after N simulation steps as defined in obj.simProp.showResultEach. For obj.simProp.showResultEach=0 the results are saved for the first and the last step. use obj.run.help for more information

%%
crystalPos          = obj.simResults.SHGexample_green.z*1e3;
PulseEnergySHG = obj.simResults.SHGexample_green.PulseEnergy*1e6;
PulseEnergyIR    = obj.simResults.SHGexample_IR.PulseEnergy*1e6;
TransformLimit   = obj.simResults.SHGexample_green.TL*1e15;
pulseDuration   = obj.simResults.SHGexample_green.pulseDurationFWHM*1e15;

%% plot data
[AX,H1,H2] = plotyy([crystalPos' crystalPos'],[PulseEnergySHG' PulseEnergyIR'],[crystalPos' crystalPos'],[TransformLimit' pulseDuration']);
set(get(AX(1),'Ylabel'),'String','pulse energy (µJ)')
set(get(AX(2),'Ylabel'),'String','pulse duration (fs)')
xlabel('crystal position (mm)')
title(obj.simProp.tag)
legend('PulseEnergySHG','PulseEnergyIR','TransformLimit','pulseDuration FWHM')
 Example 2: plot results of parameter scan using for a loop
obj.clearResults

theta=linspace(23.86,24.5,10);
for i=1:10
    [Eftfxfy_o,Eftfxfy_e]=obj.run({'pulse1','theta',theta(i)*pi/180}); %the results are plotted after N simulation step as defined in obj.simProp.showResultEach. For obj.simProp.showResultEach=0 the results are plotted for the first and the last step. use obj.run.help for more information
    obj.showProgress(i,10);
end
%%

N_z = find(obj.simResults.SHGexample_green.z==2e-3);
PulseEnergySHG = obj.simResults.SHGexample_green.PulseEnergy(N_z)*1e6;
PulseEnergyIR    = obj.simResults.SHGexample_IR.PulseEnergy(N_z)*1e6;
TransformLimit   = obj.simResults.SHGexample_IR.TL(N_z)*1e15;

[AX,H1,H2] = plotyy([theta' theta'],[PulseEnergySHG PulseEnergyIR],[theta'],[TransformLimit]);
set(get(AX(1),'Ylabel'),'String','pulse energy (µJ)')
set(get(AX(2),'Ylabel'),'String','transform limit (fs)')
xlabel('theta (°)')
title(obj.simProp.tag)
legend('PulseEnergySHG','PulseEnergyIR','TL IR')

Tino Lang
|
|
Administrator
|
This post was updated on .
4. The easiest way to save a spatial beam profile at different crystal positions is to divide the simulation in N sections, e.g. 5x 100 and save a spatial beam profiles between the sections. The handle to the plots which are automatically created by the detectors can be found in obj.simResults.handles.h_subplotsData. As an alternative the beam profile can be extracted from the electrical fields Eftfxfy_o and Eftfxfy_e after each simulation.
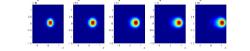
Example: Extract the spatial beam profile of the SH at 5 positions along the crystal
%% get the Ixy data for each 100 step out of 500
[Eftfxfy_o,Eftfxfy_e]=obj.run('pulse1','propagationLength',2e-3/5,'Nz',500/5);

for i=1:5

%     Ixy(:,:,i) = squeeze(abs(sum(ifftn(Eftfxfy_e),1)).^2); %temporally integrated beam profile
    Ixy(:,:,i) = get(obj.simResults.handles.h_subplotsData.SHGexample_green_2,'CData'); %the subplots of automatically generated figure are numbered from left to right starting with 0
    [Eftfxfy_o,Eftfxfy_e]=obj.run(Eftfxfy_o,Eftfxfy_e); %compute the next 100 steps

    %plot the spatial beam profiles in 5 subplots
    figure(10);subplot(1,5,i);
    pcolor(obj.constVect.x,obj.constVect.y,Ixy(:,:,i));
    shading flat
    drawnow

end
Tino Lang
|
|
|
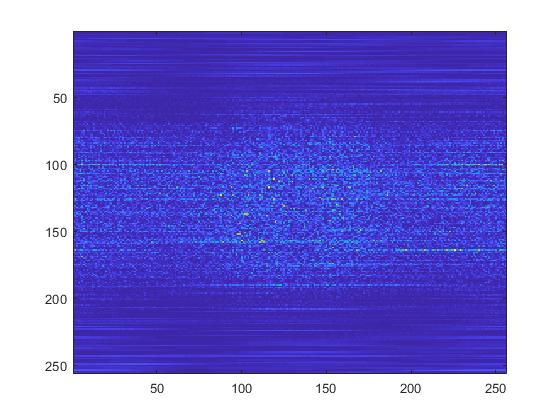
In the previous reply you wrote:
% Ixy(:,:,i) = squeeze(abs(sum(ifftn(Eftfxfy_e),1)).^2); %temporally integrated beam profile
I tried
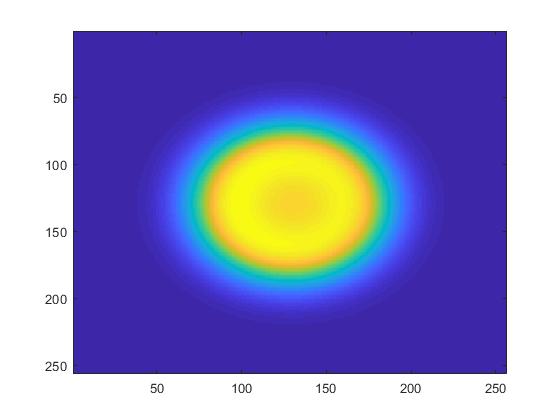
Ixy_o = squeeze(abs(sum(ifftn(E_ftfxfy_o),1)).^2);
and got:
 while
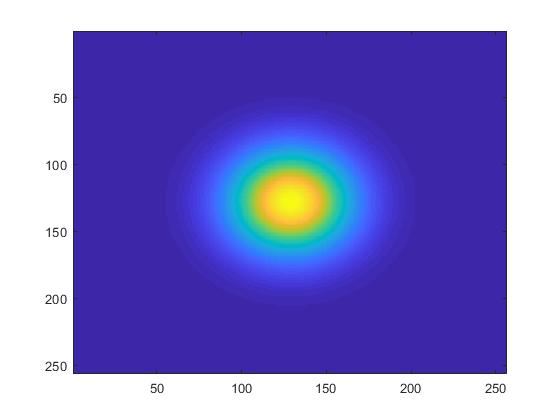
Ixy_o2 = get(obj.simResults.handles.h_subplotsData.obs1_2,'CData');
gave me:
 then I tried
Ixy_o = squeeze(abs(sum(ifftn(E_ftfxfy_o),2)).^2);
and got:
 while
Ixy_o2 = get(obj.simResults.handles.h_subplotsData.obs1_1,'CData');
gave me:
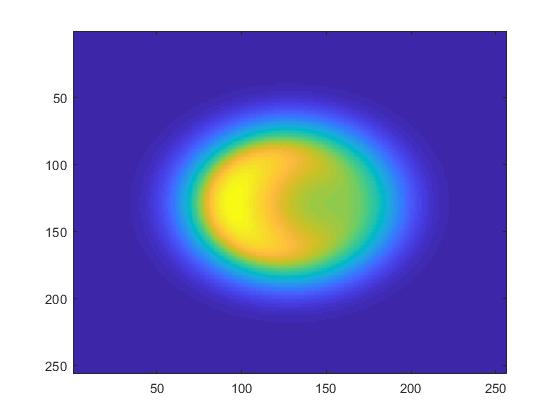 (I decided to show the remaining part of the pump of the SHG because the Ixy and Ixt profiles are clearly different due to the depletion, unlike the extraordinary output, where they can be very similar.)
Could you please clarify how to get the Ixt/Iyt/Ixy profiles from E_ftfxfy_o or _e arrays?
Thank you,
Gabor
|
|
Administrator
|
This post was updated on .
Dear Garbor,
I am actually surprised why it worked with the previews example.
Ixy_o = squeeze(abs(sum(ifftn(E_ftfxfy_o),1)).^2);
This integrates the complex field over time which makes no sense.
You can try to first do abs().^2 and then the sum() over time
Ixy_o = squeeze( sum( abs( ifftn(E_ftfxfy_o) ).^2 , 1) );
Tino Lang
|
|

