|
|
|
|
This post was updated on .
Hi,
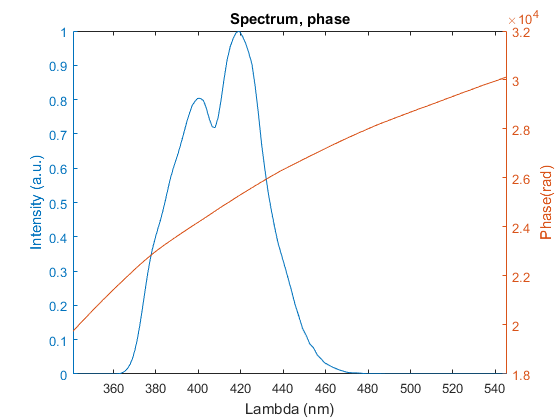
I have used getSpectrum to extract spectral inentsity and phase. However, the result is not the same as that from Chi2D. I also want to get spectral GD, GDD and TOD and I was wondering if there are defined functions in Chi3D? A sample code that I used is:
[I_freq_obs1,I_lam_obs1,Phase_obs1]=getSpectrum(obj,E_ftfxfy_e,'detector','obs1','alpha',[0,0]);
figure
yyaxis left;
plot(1e9*obj.constVect.lambda,I_lam_obs1/max(I_lam_obs1));
ylabel('Intensity (a.u.)');
yyaxis right;
plot(1e9*obj.constVect.lambda,flip(Phase_obs1));
ylabel ('Phase(rad)')
xlim1=1e9*3e8/obj.detectors.obs1.ftlim(1);
xlim2=1e9*3e8/obj.detectors.obs1.ftlim(2);
xlim([xlim2 xlim1]);
title('Spectrum, phase');
xlabel('Lambda (nm)');
|
|
Administrator
|
Hi Mojtaba,
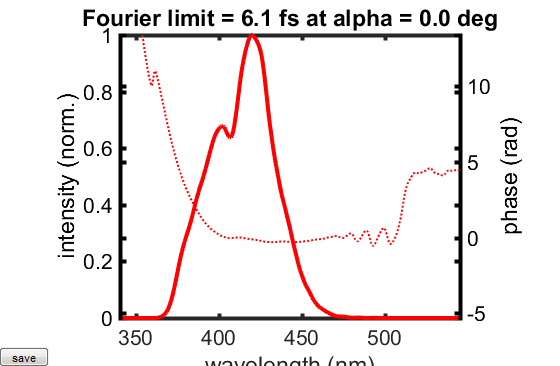
I was able to reproduce the described behavior of chi3D. The problem was a constant GD offset between the measurements of the phase in chi2D and chi3D. Whereas the phase calculation in chi2D includes a GD offset subtraction (GD@spectral center of gravity subtraction) this was not the case in chi3D.
I implemented a new getSpectrum() method which includes now the GD offset subtraction and added the GD and GDD calculation. Please note that the GD calculated in getSpectrum is not an absolute number but the relative timing of spectral components in respect to the GD at the spectral center of gravity.
Best,
Tino
Tino Lang
|
|
|
Hi Tino,
Thank you for looking into the problem. If I understand correctly a new getSpectrum() method has been implemented in chi3D.
1- Would it be possible that I get the updated chi3D program?
2- Can you please give an example here that shows how to extract, phase, GD, and GDD?
3- Can you implement TOD and FOD in chi3D?
Best,
Mojtaba
|
|
Administrator
|
Hi,
1. I send it via email
2. [I_ freq,I_lam,Phase,GD,GDD]=getSpectrum(obj , Eftfxfy,'PropertyName',propertyvalue);
3. In principle this could be easily be implemented. However, do to numerical errors higher oder terms will be
quite noisy. You can try the following code:
[I_freq_obs2,I_lam_obs2,Phase_obs2,GD_obs2,GDD_obs2]=getSpectrum(obj,E_ftfxfy_e,'detector','obs2','alpha',[0,0]);

figure(10)

yyaxis left;
plot(1e9*obj.constVect.lambda,I_lam_obs2/max(I_lam_obs2));
ylabel('Intensity (a.u.)');
yyaxis right;
plot(1e9*obj.constVect.lambda,Phase_obs2);
ylabel ('phase (rad)')
xlim1=1e9*3e8/obj.detectors.obs2.ftlim(1);
xlim2=1e9*3e8/obj.detectors.obs2.ftlim(2);
xlim([xlim2 xlim1]);
title('Spectrum, phase');
xlabel('Lambda (nm)');

figure(11)

yyaxis left;
plot(1e9*obj.constVect.lambda,I_lam_obs2/max(I_lam_obs2));
ylabel('Intensity (a.u.)');
yyaxis right;
plot(1e9*obj.constVect.lambda,GD_obs2*1e15);
ylabel ('GD (fs)')
xlim1=1e9*3e8/obj.detectors.obs2.ftlim(1);
xlim2=1e9*3e8/obj.detectors.obs2.ftlim(2);
xlim([xlim2 xlim1]);
title('Spectrum, GD');
xlabel('Lambda (nm)');

figure(12)

yyaxis left;
plot(1e9*obj.constVect.lambda,I_lam_obs2/max(I_lam_obs2));
ylabel('Intensity (a.u.)');
yyaxis right;
plot(1e9*obj.constVect.lambda,GDD_obs2*1e15);
ylabel ('GDD (fs²)')
xlim1=1e9*3e8/obj.detectors.obs2.ftlim(1);
xlim2=1e9*3e8/obj.detectors.obs2.ftlim(2);
xlim([xlim2 xlim1]);
title('Spectrum, GDD');
xlabel('Lambda (nm)');

figure(13)

yyaxis left;

TOD=gradient(GDD_obs2,2*pi*obj.constVars.dft);
plot(1e9*obj.constVect.lambda,I_lam_obs2/max(I_lam_obs2));
ylabel('Intensity (a.u.)');
yyaxis right;
plot(1e9*obj.constVect.lambda,TOD*1e45);
ylabel ('TOD (fs³)')
xlim1=1e9*3e8/obj.detectors.obs2.ftlim(1);
xlim2=1e9*3e8/obj.detectors.obs2.ftlim(2);
xlim([xlim2 xlim1]);
title('Spectrum, TOD');
xlabel('Lambda (nm)');


figure(14)

yyaxis left;

FOD=gradient(TOD,2*pi*obj.constVars.dft);
plot(1e9*obj.constVect.lambda,I_lam_obs2/max(I_lam_obs2));
ylabel('Intensity (a.u.)');
yyaxis right;
plot(1e9*obj.constVect.lambda,FOD*1e60);
ylabel ('FOD (fs^4)')
xlim1=1e9*3e8/obj.detectors.obs2.ftlim(1);
xlim2=1e9*3e8/obj.detectors.obs2.ftlim(2);
xlim([xlim2 xlim1]);
title('Spectrum, FOD');
xlabel('Lambda (nm)');
Tino Lang
|
|
|
Thank you for the example to plot the spectrum and the phase.
Is there a way to put it in the detector's plot and see it's evolution during the simulation?
Thank you,
Gabor
|
|
Administrator
|
Dear Gabor,
There is currently no way to add additional plots to the detector plot. Just see it as a control what is going on during the simulation.
But there is a way to plot, save, calculate, ... everything you want during the simulation. Here an example:
obj = chi3D();

obj('inloopFun','myfun'); %the string in obj.simProp.inloopFun defines an external function which will be called during each loop of the simulation
and here an example for myfun.m:
function myfun()

% evalin('caller', 'who') %you can figure out which internal variables are used in the code if you set a break here during calling your simulation and execute evalin('caller', 'who')

k=evalin('caller', 'k');disp(k) %k is an integer control variable of the simulation loop, e.g. for k=1:N,...,end

obj=evalin('caller', 'obj'); % current chi3D object within the loop
E_ftfxfy=evalin('caller', 'Eftfxfy_o'); % ordinary complex field after k loops


if(~mod(k,10)) % to speed up the simulation

    [I_freq,I_lam,Phase,GD,GDD]=obj.getSpectrum(E_ftfxfy,'alpha',obj.beamProp.alpha_x_pulse2) ; % alpha is the propagation angle of the spectral components of interest. Only needed for phase, GD, GDD,...
    figure(111)

    yyaxis left
    plot(obj.constVect.lambda,I_lam./max(I_lam))
    xlim([450e-9 550e-9])
    ylabel('Spectral Intensity (norm.)')
    xlabel('Wavelength (nm)')

    yyaxis right
    plot(obj.constVect.lambda,GDD*1e30)
    ylabel('GDD (fs2)')

end
Tino Lang
|
|

